#3 IRF1, STAT1 and STAT2 are key regulators of IFN-α signaling
Mireia Ramos-Rodríguez
Details
Original publication:
Colli, M.L., Ramos-Rodríguez, M., Nakayasu, E.S. et al. An integrated multi-omics approach identifies the landscape of interferon-α-mediated responses of human pancreatic beta cells. Nat Commun 11, 2584 (2020). https://doi.org/10.1038/s41467-020-16327-0
Contents: Analyses and figures contained in this document correspond to the following figures/sections of the original publication:
- Results: “IRF1, STAT1 and STAT2 are key regulators of IFN-\(\alpha\) signaling”.
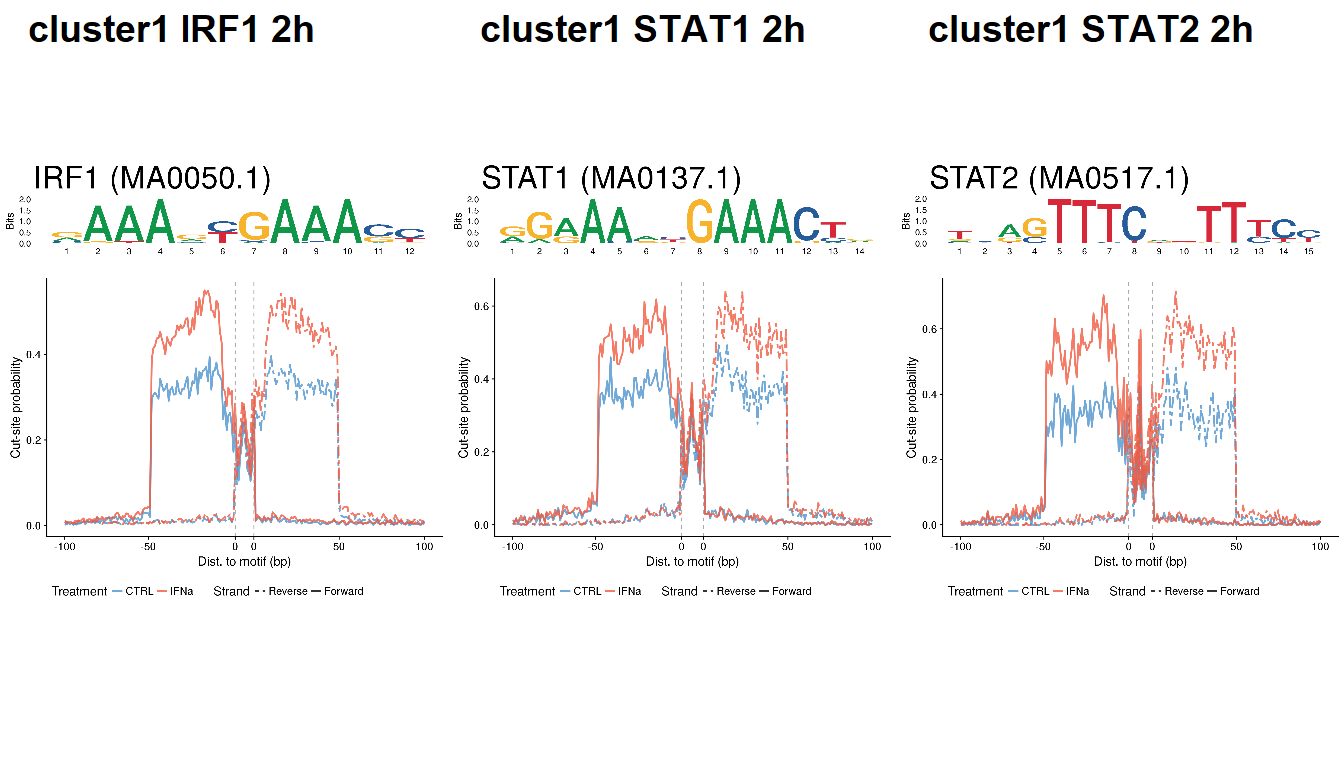
- Figure 2: “IRF1, STAT1 and STAT2 regulate IFN\(\alpha\)-induced transcription and the expression of checkpoint proteins”. Panel b.
Methods
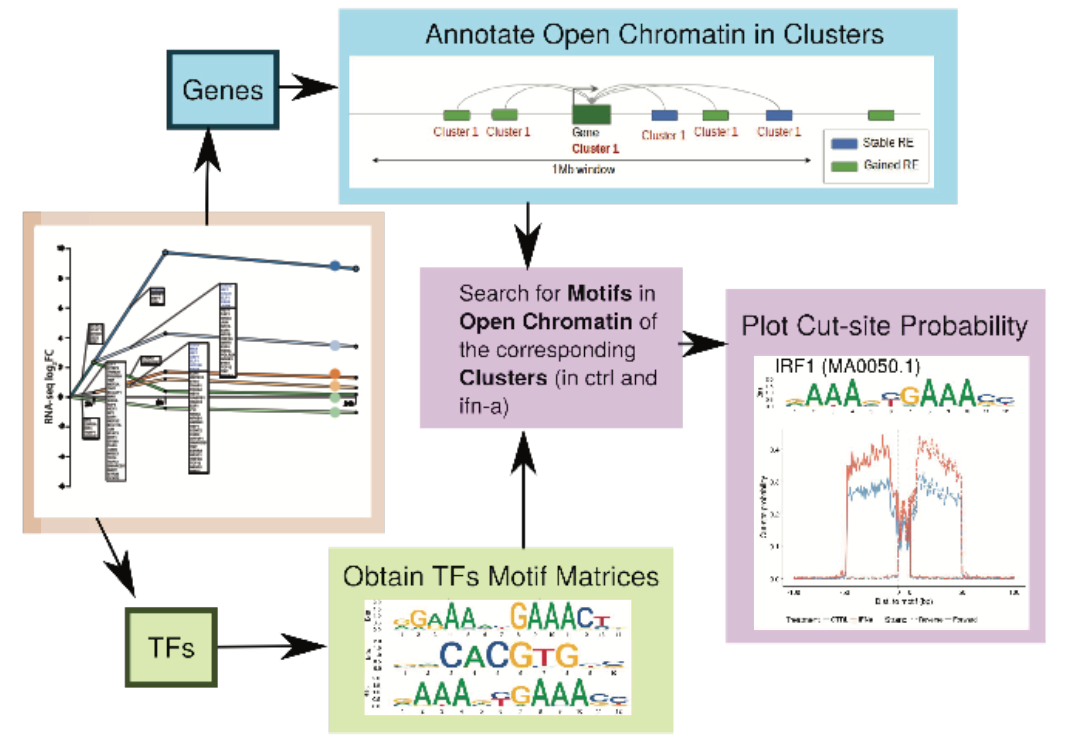
- Assign each open chromatin region (stable/gained/lost) to the nearest gene that is annotated in any of the clusters. Such open chromatin region will also be annotated to the cluster where the gene belongs. Filter out the open chromatin regions that are more than 1Mb away from the TSS of any gene.
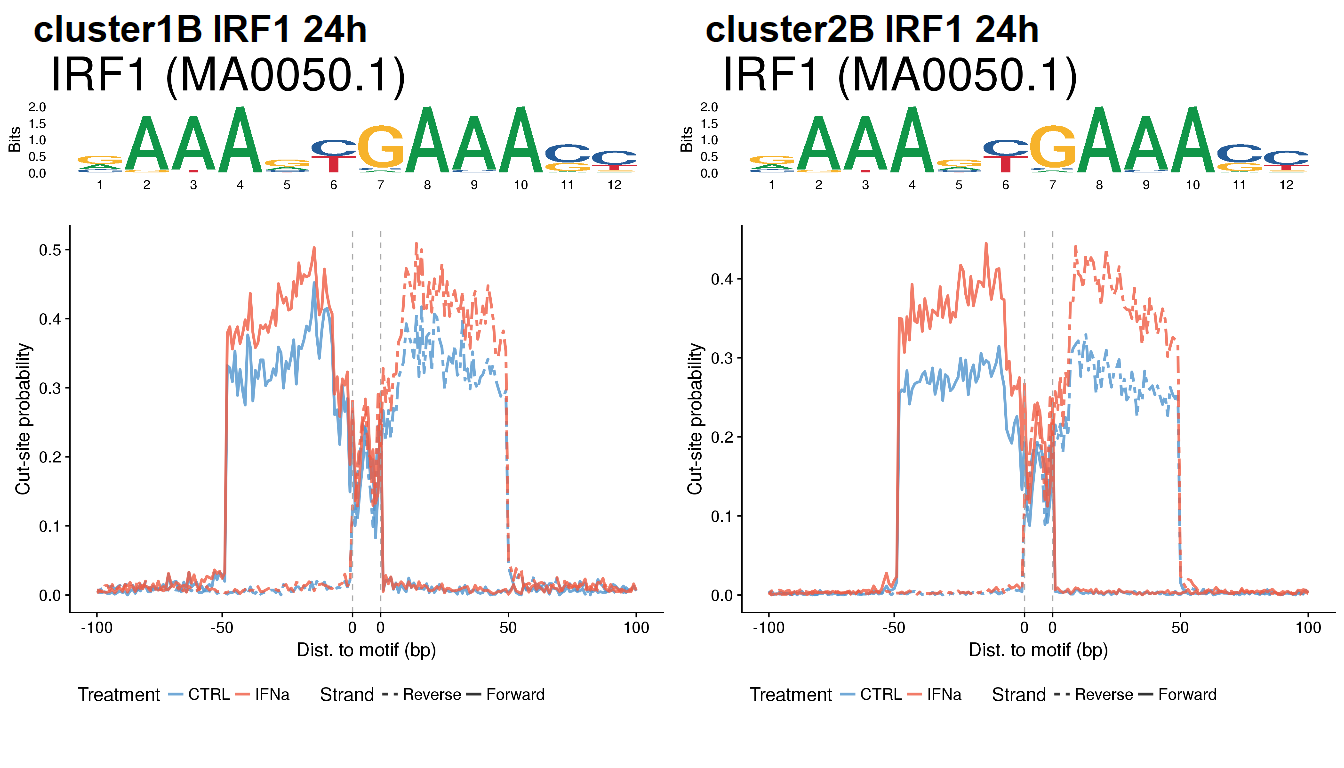
- In the case of open chromatin present at 2h we are annotating them to clusters defined at two hours. The same with 24h (see table below).
- Perform footprint analysis of the TF regulating the cluster in the open chromatin regions that were annotated to the cluster.
| 2 hours | 24 hours |
|---|---|
| Cluster 1 | Cluster 1A |
| Cluster 1B | |
| Cluster 1C | |
| Cluster 2 | Cluster 2A |
| Cluster 2B | |
| Cluster 3 | Cluster 3 |

clusters <- c("cluster1", "cluster2", "cluster3", "cluster1A", "cluster1B", "cluster1C", "cluster2B")
tf <- read.csv("../data/IFNa/clusters_RNA/tf_clusters_ifna.csv",
               stringsAsFactors=FALSE)
colnames(tf) <- clusters

genes <- read.csv("../data/IFNa/clusters_RNA/gene_clusters_ifna.csv",
                  stringsAsFactors=FALSE)
colnames(genes) <- clusters

## Create df for TF
cluster <- c()
for (i in clusters) cluster <- c(cluster, rep(i, nrow(tf[tf[,i]!="",])))
tfs <- c()
for (i in 1:length(clusters)) tfs <- c(tfs, tf[tf[,i]!="",i])

clust.tf <- data.frame("cluster"=cluster,
                       "TFs"=tfs)
save(clust.tf, file="../data/IFNa/clusters_RNA/tf_clusters_ifna.rda")

## Create df for genes
cluster <- c()
for (i in clusters) cluster <- c(cluster, rep(i, nrow(genes[genes[,i]!="",])))
tfs <- c()
for (i in 1:length(clusters)) tfs <- c(tfs, genes[genes[,i]!="",i])

clust.genes <- data.frame("cluster"=cluster,
                       "external_gene_name"=tfs)
save(clust.genes, file="../data/IFNa/clusters_RNA/gene_clusters_ifna.rda")


## Obtain coordinates for genes
load("../data/IFNa/RNA/diffAnalysis/res_2h.rda")
coord <- res.df_2h[,c(21:24)]
coord$external_gene_name <- toupper(coord$external_gene_name)


table(clust.genes$external_gene_name %in% coord$external_gene_name)

na <- clust.genes[!(clust.genes$external_gene_name %in% unique(coord$external_gene_name)),]
alt <- getNameFromAlias(na$external_gene_name)

## Replace for symbols
clust.genes$external_gene_name <- as.character(clust.genes$external_gene_name)
clust.genes <- clust.genes[order(clust.genes$external_gene_name),]
alt <- alt[order(alt$alias_symbol),]

for (i in 1:nrow(alt)) {
  clust.genes$external_gene_name[clust.genes$external_gene_name==alt$alias_symbol[i]] <- alt$symbol[i]
}

table(clust.genes$external_gene_name %in% coord$external_gene_name)

clust.genes.coord <- dplyr::inner_join(clust.genes, coord)
clust.genes.coord$cluster <- as.character(clust.genes.coord$cluster)
clust.genes.gr <- regioneR::toGRanges(clust.genes.coord[,c(3:5, 1:2)])
save(clust.genes.gr, file="../data/IFNa/clusters_RNA/gene_clusters_ifna_granges.rda")
table(clust.genes.gr$cluster)

## Annotate open chromatin regions to closest gene in corresponding cluster
rm(list=ls())
load("../data/IFNa/clusters_RNA/gene_clusters_ifna_granges.rda")

load("../data/IFNa/ATAC/diffAnalysis/res.2h.rda")
res.2h <- regioneR::toGRanges(res.2h.df[,c(17:19, 1:16)])
load("../data/IFNa/ATAC/diffAnalysis/res.24h.rda")
res.24h <- regioneR::toGRanges(res.24h.df[,c(17:19, 1:16)])
rm(res.24h.df, res.2h.df)

c2 <- c("cluster1", "cluster2", "cluster3") ## clusters at 2h
c24 <- c("cluster3", "cluster1A", "cluster1B", "cluster1C", "cluster2B") ## clusters at 24h
cl.atac.2h <- ChIPseeker::annotatePeak(res.2h, TxDb=clust.genes.gr[clust.genes.gr$cluster %in% c2],
                                       verbose=FALSE)
cl.atac.24h <- ChIPseeker::annotatePeak(res.24h, TxDb=clust.genes.gr[clust.genes.gr$cluster %in% c24],
                                        verbose=FALSE)

## Filter out regions if distanceToTSS > 1Mb
dist <- 1000000
cl.atac.2h <- data.frame(cl.atac.2h)
cl.atac.24h <- data.frame(cl.atac.24h)

cl.atac.2h <- unique(cl.atac.2h[abs(cl.atac.2h$distanceToTSS) <= dist,])
cl.atac.24h <- unique(cl.atac.24h[abs(cl.atac.24h$distanceToTSS) <= dist,])

save(cl.atac.2h, file=file.path(out_dir, "atac_clusters_ifna_2h.rda"))
save(cl.atac.24h, file=file.path(out_dir, "atac_clusters_ifna_24h.rda"))
The number of regions annotated to each RNA cluster is:
load(file.path(out_dir, "atac_clusters_ifna_2h.rda"))
load(file.path(out_dir, "atac_clusters_ifna_24h.rda"))

cl.atac.2h.gr <- regioneR::toGRanges(cl.atac.2h[,-c(4:5)])
cl.atac.24h.gr <- regioneR::toGRanges(cl.atac.24h[,-c(4:5)])

knitr::kable(table(cl.atac.2h$cluster, cl.atac.2h$type),
caption="OCRs at 2h annotated to each RNA-seq cluster.")| gained | stable | |
|---|---|---|
| cluster1 | 419 | 24609 |
| cluster2 | 947 | 55003 |
| cluster3 | 146 | 14001 |
knitr::kable(table(cl.atac.24h$cluster, cl.atac.24h$type),
caption="OCRs at 24h annotated to each RNA-seq cluster.")| gained | lost | stable | |
|---|---|---|---|
| cluster1A | 30 | 1 | 4991 |
| cluster1B | 65 | 5 | 12765 |
| cluster1C | 36 | 0 | 11738 |
| cluster2B | 97 | 1 | 28204 |
| cluster3 | 27 | 1 | 15537 |
Footprint analysis
The code used for calculating the footprints of all TFs outputed by the DREM model was ran using the following Rscript:
Rscript code/IFNa_TF_footprint.RWarning: Currently, TFBSTools is not working as expected…
library(TFBSTools)
library(ggseqlogo)

## Load data ---------------------------------
load("../data/IFNa/clusters_RNA/tf_clusters_ifna.rda")
clust.tf$cluster <- as.character(clust.tf$cluster)
clust.tf$TFs <- as.character(clust.tf$TFs)

opts <- list()
opts[["species"]] <- 9606
opts[["matrixtype"]] <- "PWM"
opts[["all_versions"]] <- TRUE
matJaspar <- getMatrixSet(JASPAR2016::JASPAR2016, opts)

## Load matrix FOXA2
mot.f <- read.delim("../data/IFNa/TF_motifs/fox2.motif", header=FALSE)
mot.f <- t(mot.f)
rownames(mot.f) <- c("A", "C", "G", "T")
mot <- mot.f*1000

pfm.foxa2 <- PFMatrix(ID="Human-Islets-FOXA2",
                name="FOXA2",
                profileMatrix=mot)

## Obtain list of TF and TF IDs
tf.id <- data.frame("tf"=unique(clust.tf$TFs),
                    "id"=NA,
                    stringsAsFactors=FALSE)
tf.id <- rbind(tf.id, c("FOXA2", "HumanIslet-FOXA2"))

sel <- c("STAT1", "STAT2", "IRF1")
tf.id <- tf.id[tf.id$tf %in% sel,]

for (i in unique(clust.tf$TFs)) {
  mot <- matJaspar[grep(i, name(matJaspar))]

    if (length(mot) > 0) {
      name <- ID(mot)[[1]]
      tf.id$id[tf.id$tf==i] <- name
    } else {
      next
    }
}

tf.id <- tf.id[!is.na(tf.id$id),]

##------------------------------------------------
## 2 hours
##------------------------------------------------
## Plot footprints (manually)
# dir.create("Figs_2h/", F)

## Set labels
upstream=100
downstream=100

for (i in c2) {
  for (j in unique(clust.tf$TFs[clust.tf$cluster==i])) {
    if (!(j %in% tf.id$tf)) next
    else {
      v <- matJaspar[grep(tf.id$id[tf.id$tf==j], ID(matJaspar))]

      if (length(v)==0) {
        mot <- pfm.foxa2
      } else {
        mot <- Matrix(matJaspar[grep(tf.id$id[tf.id$tf==j], ID(matJaspar))][[1]])
      }

      load(file.path(out_dir, paste0("footprint_", i, "_", j, "_2h.rda")))
      ctrl$Treatment <- "CTRL"
      ifn$Treatment <- "IFNa"
      df <- rbind(ctrl, ifn)

      ## Set breaks and labels
      nmotif = ncol(mot)
      breaks <- c(min(ctrl$Position), (upstream+1), (upstream+nmotif), max(ctrl$Position))
      breaks <- c(breaks, round(breaks[2]/2, 0), round((breaks[4]-breaks[3])/2 + breaks[3], 0))
      breaks <- sort(breaks)
      labels <- c(paste0("-", upstream),
                  paste0("-", upstream/2),
                  "0", "0",
                  paste(downstream/2),
                  paste(downstream))

      xlab = "Dist. to motif (bp)"
      ylab = "Cut-site probability"

      profile <- ggplot(df, aes(Position, Probability)) +
                  geom_line(aes(color=Treatment, lty=Strand), lwd=1, alpha=0.8) +
                  scale_linetype_manual(values=c("Forward"=1, "Reverse"=6)) +
                  scale_color_manual(values=c("CTRL"="steelblue3", "IFNa"="tomato2")) +
                  geom_vline(xintercept=breaks[3], lty=2, color="dark grey") +
                  geom_vline(xintercept=breaks[4], lty=2, color="dark grey") +
                  theme(legend.position="bottom") +
                  scale_x_continuous(breaks=breaks,
                             labels=labels) +
                  xlab(xlab) + ylab(ylab)

        logo <- ggseqlogo(mot, seq_type="dna") +
        ggtitle(paste0(j, " (", ID(matJaspar[grep(tf.id$id[tf.id$tf==j], ID(matJaspar))][[1]]), ")")) +
        theme(plot.title = element_text(size=35))

      final <- plot_grid(logo, profile, ncol=1, rel_heights=c(1,3))
    }
  }
}

final

##-----------------------------------------------------
## 24 hours
##-----------------------------------------------------
# dir.create("Figs_24h/", F)

for (i in c24) {
  for (j in unique(clust.tf$TFs[clust.tf$cluster==i])) {
    if (!(j %in% tf.id$tf)) next
    else {
      v <- matJaspar[grep(tf.id$id[tf.id$tf==j], ID(matJaspar))]

      if (length(v)==0) {
        mot <- pfm.foxa2
      } else {
        mot <- Matrix(matJaspar[grep(tf.id$id[tf.id$tf==j], ID(matJaspar))][[1]])
      }

      load(file.path(out_dir, paste0("footprint_", i, "_", j, "_24h.rda")))
      ctrl$Treatment <- "CTRL"
      ifn$Treatment <- "IFNa"
      df <- rbind(ctrl, ifn)

      ## Set breaks and labels
      nmotif = ncol(mot)
      breaks <- c(min(ctrl$Position), (upstream+1), (upstream+nmotif), max(ctrl$Position))
      breaks <- c(breaks, round(breaks[2]/2, 0), round((breaks[4]-breaks[3])/2 + breaks[3], 0))
      breaks <- sort(breaks)
      labels <- c(paste0("-", upstream),
                  paste0("-", upstream/2),
                  "0", "0",
                  paste(downstream/2),
                  paste(downstream))

      xlab = "Dist. to motif (bp)"
      ylab = "Cut-site probability"

      profile <- ggplot(df, aes(Position, Probability)) +
                  geom_line(aes(color=Treatment, lty=Strand), lwd=1, alpha=0.8) +
                  scale_linetype_manual(values=c("Forward"=1, "Reverse"=6)) +
                  scale_color_manual(values=c("CTRL"="steelblue3", "IFNa"="tomato2")) +
                  geom_vline(xintercept=breaks[3], lty=2, color="dark grey") +
                  geom_vline(xintercept=breaks[4], lty=2, color="dark grey") +
                  theme(legend.position="bottom") +
                  scale_x_continuous(breaks=breaks,
                             labels=labels) +
                  xlab(xlab) + ylab(ylab)

        logo <- ggseqlogo(mot, seq_type="dna") +
        ggtitle(paste0(j, " (", ID(matJaspar[grep(tf.id$id[tf.id$tf==j], ID(matJaspar))][[1]]), ")")) +
        theme(plot.title = element_text(size=35))

      final <- plot_grid(logo, profile, ncol=1, rel_heights=c(1,3))
    }
  }
}

final

sessionInfo()R version 4.0.2 (2020-06-22)
Platform: x86_64-w64-mingw32/x64 (64-bit)
Running under: Windows 10 x64 (build 18362)
Matrix products: default
locale:
[1] LC_COLLATE=Spanish_Spain.1252 LC_CTYPE=Spanish_Spain.1252
[3] LC_MONETARY=Spanish_Spain.1252 LC_NUMERIC=C
[5] LC_TIME=Spanish_Spain.1252
attached base packages:
[1] grid parallel stats4 stats graphics grDevices utils
[8] datasets methods base
other attached packages:
[1] DESeq2_1.29.7 SummarizedExperiment_1.19.6
[3] DelayedArray_0.15.7 matrixStats_0.56.0
[5] Matrix_1.2-18 Biobase_2.49.0
[7] ComplexHeatmap_2.5.3 dplyr_1.0.0
[9] kableExtra_1.1.0 cowplot_1.0.0
[11] ggplot2_3.3.2 GenomicRanges_1.41.5
[13] GenomeInfoDb_1.25.8 IRanges_2.23.10
[15] S4Vectors_0.27.12 BiocGenerics_0.35.4
[17] workflowr_1.6.2
loaded via a namespace (and not attached):
[1] bitops_1.0-6 fs_1.4.2 bit64_0.9-7.1
[4] webshot_0.5.2 RColorBrewer_1.1-2 httr_1.4.2
[7] rprojroot_1.3-2 tools_4.0.0 backports_1.1.8
[10] R6_2.4.1 DBI_1.1.0 colorspace_1.4-1
[13] GetoptLong_1.0.2 withr_2.2.0 tidyselect_1.1.0
[16] bit_1.1-15.2 compiler_4.0.0 git2r_0.27.1
[19] rvest_0.3.6 xml2_1.3.2 labeling_0.3
[22] rtracklayer_1.49.4 bookdown_0.20 scales_1.1.1
[25] readr_1.3.1 genefilter_1.71.0 Rsamtools_2.5.3
[28] stringr_1.4.0 digest_0.6.25 rmarkdown_2.3
[31] XVector_0.29.3 pkgconfig_2.0.3 htmltools_0.5.0
[34] highr_0.8 BSgenome_1.57.5 regioneR_1.21.1
[37] rlang_0.4.7 GlobalOptions_0.1.2 rstudioapi_0.11
[40] RSQLite_2.2.0 farver_2.0.3 shape_1.4.4
[43] generics_0.0.2 BiocParallel_1.23.2 RCurl_1.98-1.2
[46] magrittr_1.5 GenomeInfoDbData_1.2.3 Rcpp_1.0.5
[49] munsell_0.5.0 lifecycle_0.2.0 stringi_1.4.6
[52] yaml_2.2.1 zlibbioc_1.35.0 blob_1.2.1
[55] promises_1.1.1 crayon_1.3.4 lattice_0.20-41
[58] Biostrings_2.57.2 splines_4.0.0 annotate_1.67.0
[61] circlize_0.4.10 hms_0.5.3 magick_2.4.0
[64] locfit_1.5-9.4 knitr_1.29 pillar_1.4.6
[67] rjson_0.2.20 geneplotter_1.67.0 XML_3.99-0.5
[70] glue_1.4.1 evaluate_0.14 png_0.1-7
[73] vctrs_0.3.2 httpuv_1.5.4 gtable_0.3.0
[76] purrr_0.3.4 clue_0.3-57 xfun_0.16
[79] xtable_1.8-4 later_1.1.0.1 survival_3.2-3
[82] viridisLite_0.3.0 tibble_3.0.3 GenomicAlignments_1.25.3
[85] AnnotationDbi_1.51.3 memoise_1.1.0 cluster_2.1.0
[88] ellipsis_0.3.1