#3 Subclassification of IREs
Primed and neo induced regulatory elements mediate cytokine response
Mireia Ramos-Rodríguez
Details
- Original publication:
Ramos-Rodríguez, M., Raurell-Vila, H., Colli, M.L. et al. The impact of proinflammatory cytokines on the β-cell regulatory landscape provides insights into the genetics of type 1 diabetes. Nat Genet. 51, 1588–1595 (2019) https://doi.org/10.1038/s41588-019-0524-6
Contents: Analyses and figures contained in this document correspond to the following figures/sections of the original publication:
- Results: “Primed and neo-regulatory elements mediate cytokine response”.
- Figure 2: “The β-cell response to proinflammatory cytokines unveils neo and primed IREs”. Panels c to f.
- Extended Data Figure 3: “Characterization of \(\beta\)-cell IREs”. Panels a to k.
Subclassification of IREs
To determine which IREs were not accessible in control conditions, we call peaks from merged control BAM file with a relaxed threshold: P<0.05.
macs2 callpeak -f BAM -t data/CYT/ATAC/BAM/merged/endoc_ctrl.offset.bam -g hs --outdir data/CYT/ATAC/Peaks/relaxed/ -n endoc_ctrl_relaxed --tempdir data/CYT/ATAC/Peaks/tmp/ -p 0.05 --nomodel --shift -100 --extsize 200load("../data/CYT/REs/REs_endoc_fc1_padj0.05_granges.rda")
re <- re[!is.na(re$type),]
## Save first subgroup
re$subgroup1 <- NA
re$subgroup1[grep("SRE", re$type)] <- "SRE"
re$subgroup1[re$atac.type=="gained" & re$h3k27ac.type=="gained"] <- "Opening IRE"
re$subgroup1[re$atac.type=="stable" & re$h3k27ac.type=="gained"] <- "Primed IRE"
## Save 2nd subgroup
re$subgroup2 <- re$subgroup1
relaxed <- regioneR::toGRanges(paste0("../../data/ATAC/Peaks/relaxed/endoc_ctrl_relaxed_peaks.narrowPeak"))
ols <- subsetByOverlaps(re[re$subgroup1=="Opening IRE",],
relaxed)$atac.GeneID
re$subgroup2[re$atac.GeneID %in% ols &
re$subgroup1=="Opening IRE"] <- "Other IRE"
re$subgroup2[!(re$atac.GeneID %in% ols) &
re$subgroup1=="Opening IRE"] <- "Neo IRE"
save(re, file="../data/CYT/REs/REs_endoc_fc1_padj0.05_granges_subgroup.rda")
## With less stringent threshold ---
load("../data/CYT/REs/REs_endoc_fc1_padj0.05_granges_k27.8.rda")
re <- re[!is.na(re$type),]
## Save first subgroup
re$subgroup1 <- NA
re$subgroup1[grep("SRE", re$type)] <- "SRE"
re$subgroup1[re$atac.type=="gained" & re$h3k27ac.type=="gained"] <- "Opening IRE"
re$subgroup1[re$atac.type=="stable" & re$h3k27ac.type=="gained"] <- "Primed IRE"
## Save 2nd subgroup
re$subgroup2 <- re$subgroup1
relaxed <- regioneR::toGRanges(paste0("../data/CYT/ATAC/Peaks/relaxed/endoc_ctrl_relaxed_peaks.narrowPeak"))
ols <- subsetByOverlaps(re[re$subgroup1=="Opening IRE",],
relaxed)$atac.GeneID
re$subgroup2[re$atac.GeneID %in% ols &
re$subgroup1=="Opening IRE"] <- "Other IRE"
re$subgroup2[!(re$atac.GeneID %in% ols) &
re$subgroup1=="Opening IRE"] <- "Neo IRE"
save(re, file="../data/CYT/REs/REs_endoc_fc1_padj0.05_granges_subgroup_k27.8.rda")load("../data/CYT/REs/REs_endoc_fc1_padj0.05_granges_subgroup.rda")
re <- data.frame(mcols(re)[,c(1,13,17,18)])
load("../data/CYT/ATAC/diffAnalysis/ATAC_endoc_normCountsBatch.rda")
counts <- data.frame(counts)
counts$atac.GeneID <- rownames(counts)
counts <- reshape2::melt(counts,
id.var=11,
value.var=1:10,
value.name="counts",
variable.name="sample")
counts$treatment <- unlist(lapply(strsplit(as.character(counts$sample), "_"),
function(x) x[2]))
counts <- counts %>%
group_by(atac.GeneID, treatment) %>%
summarise(counts=mean(counts))
colnames(counts)[3] <- "ATAC-seq"
re.counts <- dplyr::left_join(re, counts)
load("../data/CYT/H3K27ac/diffAnalysis/H3K27ac_endoc_normCountsBatch.rda")
counts <- data.frame(counts)
counts$h3k27ac.GeneID <- rownames(counts)
counts <- reshape2::melt(counts,
id.var=9,
value.var=1:8,
value.name="counts",
variable.name="sample")
counts$treatment <- unlist(lapply(strsplit(as.character(counts$sample), "_"),
function(x) x[2]))
counts <- counts %>%
group_by(h3k27ac.GeneID, treatment) %>%
summarise(counts=mean(counts))
colnames(counts)[3] <- "H3K27ac"
re.counts <- dplyr::left_join(re.counts, counts)
re.counts <- reshape2::melt(re.counts,
id.vars=1:5,
value.vars=6:7,
value.name="counts",
variable.name="experiment")
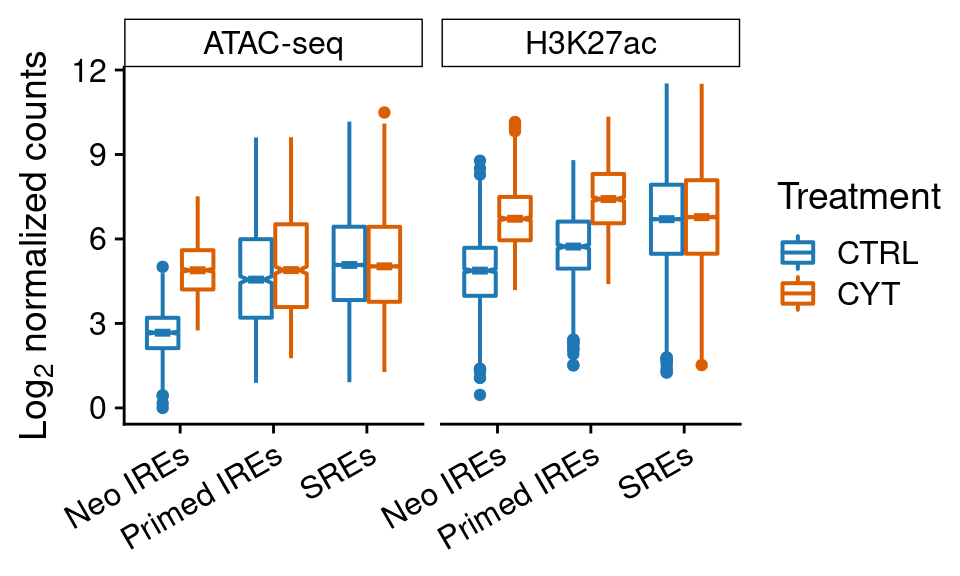
distr.reads <-
ggplot(re.counts[!grepl("Other", re.counts$subgroup2),],
aes(subgroup2, log2(counts+1))) +
geom_boxplot(aes(color=treatment), notch=TRUE, lwd=0.7) +
scale_color_manual(values=pals$treatment,
labels=function(x) toupper(x),
name="Treatment") +
facet_wrap(~experiment) +
ylab(expression(Log[2]*" normalized counts")) +
scale_x_discrete(labels=function(x) paste0(x, "s")) +
theme(axis.text.x=element_text(angle=30, hjust=1),
axis.title.x=element_blank(),
strip.background = element_rect(fill="white", color="black",
size=0.5, linetype=1))
distr.reads
| Version | Author | Date |
|---|---|---|
| 4dbeb03 | Mireia Ramos | 2020-05-13 |
Characterization
win.width=30e3

load("../data/CYT/RNA/diffAnalysis/RNA_endoc_GRangesBatch.rda")

rna <- res.gr[res.gr$gene_biotype=="protein_coding",]
win <- promoters(rna)
win <- resize(rna, width=win.width, fix="center")

load("../data/CYT/REs/REs_endoc_fc1_padj0.05_granges_subgroup.rda")
ols <- findOverlaps(re, win)

anno <- cbind(mcols(re)[queryHits(ols), c(1,17,18)],
              mcols(win)[subjectHits(ols), c(1,2,5)])

load("../data/CYT/RNA/diffAnalysis/RNA_endoc_normCountsBatch.rda")
counts <- data.frame(counts)
counts$GeneID <- rownames(counts)
counts$GeneID <- gsub("\\.[[:digit:]]*", "", counts$GeneID)

counts <- reshape2::melt(counts,
                         id.vars=11,
                         value.vars=1:10,
                         value.name="counts",
                         variable.name="sample")
counts$treatment <- unlist(lapply(strsplit(as.character(counts$sample), "_"),
                                  function(x) x[2]))

counts.mean <- counts %>%
  group_by(GeneID, treatment) %>%
  summarise(counts=mean(counts))

anno.counts <- left_join(data.frame(anno), counts.mean)
anno.counts <- unique(anno.counts[,-1])


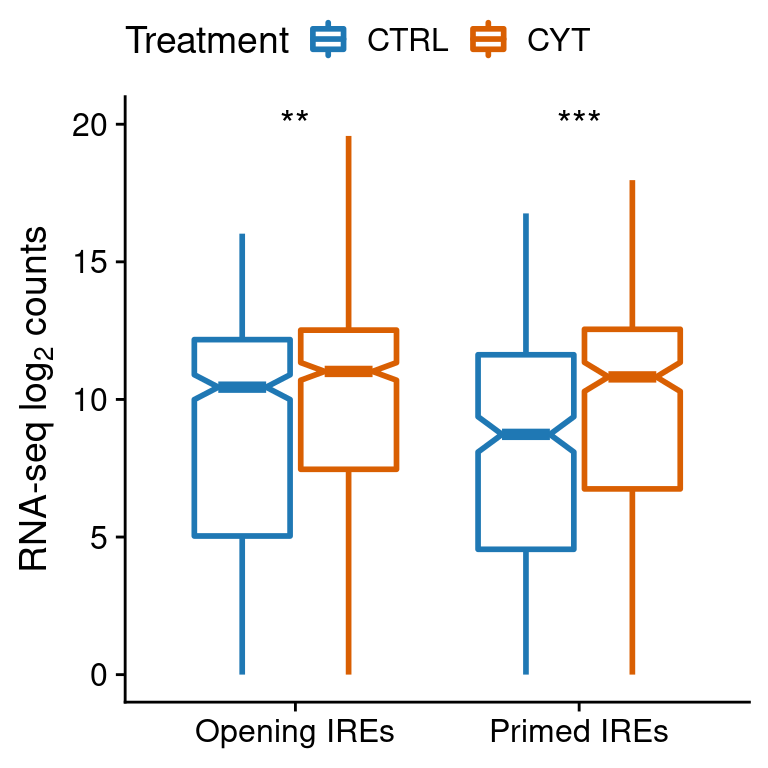
test <- anno.counts[anno.counts$subgroup2!="SRE",] %>%
  group_by(subgroup1) %>%
  summarise(pval=wilcox.test(counts[treatment=="ctrl"],
                             counts[treatment=="cyt"],
                             paired=F)$p.value)

test$lab <- ""
test$lab[test$pval<0.05] <- "*"
test$lab[test$pval<0.01] <- "**"
test$lab[test$pval<0.001] <- "***"

ggplot(anno.counts[anno.counts$subgroup2!="SRE",],
       aes(subgroup1, log2(counts + 1))) +
  geom_boxplot(aes(color=treatment), notch=TRUE,
               outlier.shape=NA, lwd=1) +
  geom_text(data=test,
            aes(x=subgroup1, y=20, label=lab),
            size=5) +
  scale_color_manual(values=pals$treatment,
                     name="Treatment",
                     labels=function(x) toupper(x)) +
  ylab(expression("RNA-seq "*log[2]*" counts")) +
  scale_x_discrete(labels=function(x) paste0(x, "s")) +
  theme(legend.position="top",
        axis.title.x=element_blank())
| Version | Author | Date |
|---|---|---|
| 4dbeb03 | Mireia Ramos | 2020-05-13 |
load(paste0("../data/CYT/REs/REs_endoc_fc1_padj0.05_granges_subgroup.rda"))
scope=1e3
bin=50

## Opening IREs
op <- re[grep("Opening", re$subgroup1),]
rnd <- regioneR::randomizeRegions(op)

op.cons <- pipelineNGS::calculateMeanCons(op,
                                           scope=scope,
                                           bin=bin)
op.cons$re_type <- "Opening IRE"
rnd.cons <- pipelineNGS::calculateMeanCons(rnd,
                                           scope=scope,
                                           bin=bin)
rnd.cons$re_type <- "Random Opening IRE"

ire.cons <- rbind(op.cons, rnd.cons)

## Primed IREs
pr <- re[grep("Primed", re$subgroup1),]
rnd <- regioneR::randomizeRegions(pr)

pr.cons <- pipelineNGS::calculateMeanCons(pr,
                                           scope=scope,
                                           bin=bin)
pr.cons$re_type <- "Primed IRE"
rnd.cons <- pipelineNGS::calculateMeanCons(rnd,
                                           scope=scope,
                                           bin=bin)
rnd.cons$re_type <- "Random Primed IRE"

## Final dataset
ire.cons <- rbind(ire.cons, pr.cons, rnd.cons)
save(ire.cons, file=file.path(out_dir, "CONS_IREs_sub.rda"))
load(file.path(out_dir, "CONS_IREs_sub.rda"))
ire.cons$color <- gsub("Random ", "", ire.cons$re_type)
ire.cons$lty <- gsub("Opening ", "", gsub("Primed ", "", ire.cons$re_type))
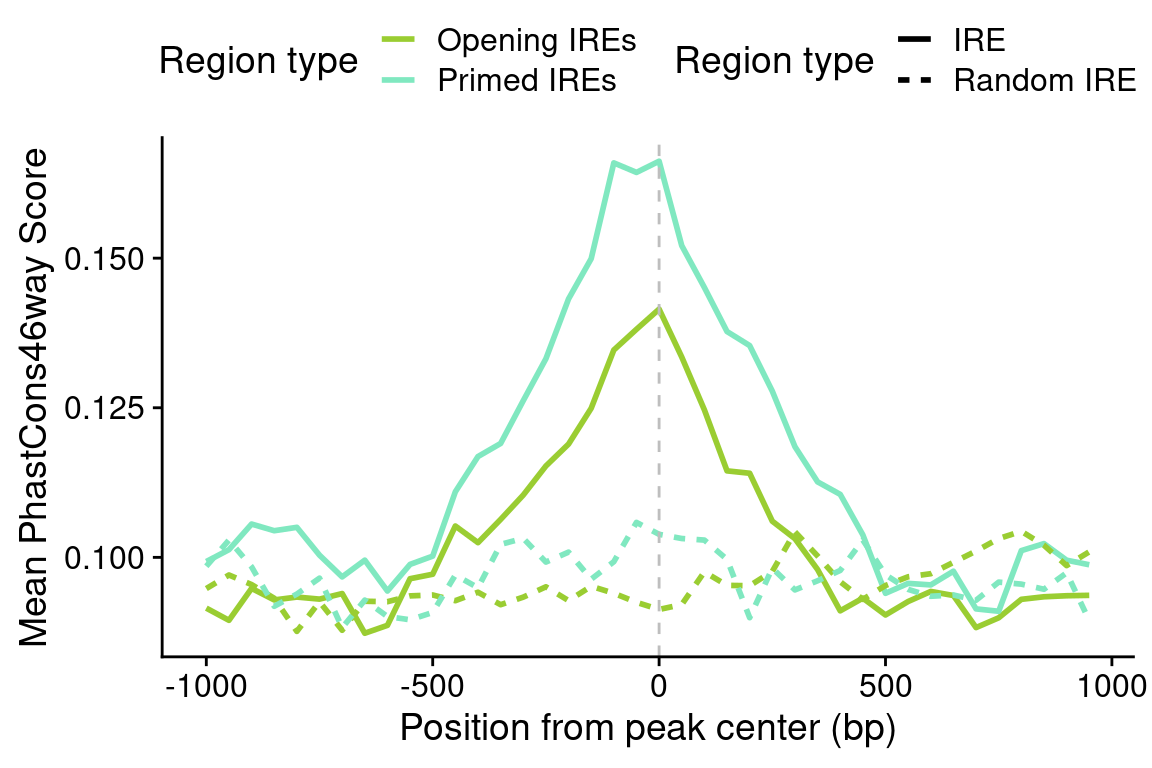
cons.plot <-
ggplot(ire.cons,
aes(position, meanCons)) +
geom_line(aes(lty=lty, color=color),
lwd=1) +
scale_linetype_discrete(name="Region type") +
scale_color_manual(values=pals$re,
name="Region type",
labels=function(x) paste0(x, "s")) +
geom_vline(xintercept=0, lty=2, color="grey") +
ylab("Mean PhastCons46way Score") +
xlab("Position from peak center (bp)") +
theme(legend.position = "top") +
guides(linetype=guide_legend(nrow=2),
color=guide_legend(nrow=2))
cons.plot
| Version | Author | Date |
|---|---|---|
| 4dbeb03 | Mireia Ramos | 2020-05-13 |
load("../data/CYT/REs/REs_endoc_fc1_padj0.05_granges_subgroup.rda")
re.df <- data.frame(re)[,-c(1:5)]

## Make groups
re.tss <- unique(re.df[!is.na(re.df$type),])

re.tss$anno.group <- NA
re.tss$anno.group[abs(re.tss$atac.distanceToTSS)>200e3] <- ">200kb"
re.tss$anno.group[abs(re.tss$atac.distanceToTSS)<=200e3 &
                    abs(re.tss$atac.distanceToTSS)>20e3] <- "20-200kb"
re.tss$anno.group[abs(re.tss$atac.distanceToTSS)<=20e3 &
                    abs(re.tss$atac.distanceToTSS)>2e3] <- "2-20kb"
re.tss$anno.group[abs(re.tss$atac.distanceToTSS)<=2e3] <- "0-2kb"

len.neo <- sum(grepl("Neo", re.tss$subgroup2))
len.primed <- sum(grepl("Primed", re.tss$subgroup2))
len.sre <- sum(grepl("SRE", re.tss$subgroup2))

sum.tss <- re.tss %>%
  group_by(subgroup2, anno.group) %>%
  summarise(num=length(unique(atac.GeneID)))

sum.tss$perc <- NA
sum.tss$perc[grep("Neo", sum.tss$subgroup2)] <- sum.tss$num[grep("Neo", sum.tss$subgroup2)]/len.neo*100
sum.tss$perc[grep("Primed", sum.tss$subgroup2)] <- sum.tss$num[grep("Primed", sum.tss$subgroup2)]/len.primed*100
sum.tss$perc[grep("SRE", sum.tss$subgroup2)] <- sum.tss$num[grep("SRE", sum.tss$subgroup2)]/len.sre*100

sum.tss <- sum.tss[!is.na(sum.tss$perc),]
sum.tss$anno.group <- factor(sum.tss$anno.group,
                             levels=c("0-2kb", "2-20kb", "20-200kb", ">200kb"))

tss.plot <-
  ggplot(sum.tss,
       aes(anno.group, perc)) +
  geom_bar(aes(fill=subgroup2), color="black", lwd=0.7, stat="identity", position="dodge") +
  geom_vline(xintercept=1.5, lty=2, color="dark red") +
  scale_fill_manual(values=pals$re,
                    name="RE type", labels=function(x) paste0(x, "s")) +
  annotate("text", x=c(1,3), y=c(60, 60), label=c("Promoters", "Enhancers")) +
  theme(legend.position="top") +
  xlab("Distance to TSS") +
  scale_y_continuous(name="Percentage of RE",
                     labels=function(x) paste0(x, "%"),
                     breaks=scales::pretty_breaks()) +
  guides(fill=guide_legend(ncol=1))

tss.plot
| Version | Author | Date |
|---|---|---|
| 4dbeb03 | Mireia Ramos | 2020-05-13 |
load("../data/CYT/REs/REs_endoc_fc1_padj0.05_granges_subgroup.rda")

## Do it on enhancers IREs
sel <- re[grep("IRE", re$type),]


files <- list.files("~/data/ChromHMM_ENCODE-Broad/",
                    pattern="*.bed",
                    full.names=TRUE)
names <- pipelineNGS::getNameFromPath(files,
                                      prefix="wgEncodeBroadHmm",
                                      suffix="HMM.bed")

chrom <- lapply(files, regioneR::toGRanges)
names(chrom) <- names

overlaps <- data.frame()
for (i in 1:length(chrom)) {
  hmm <- chrom[[i]]
  ols <- findOverlaps(sel,
                      hmm)
  df <- cbind(sel$type[queryHits(ols)],
              sel$atac.GeneID[queryHits(ols)],
              hmm$name[subjectHits(ols)])
  df <- as.data.frame(df)
  colnames(df) <- c("type", "peakID", "chromHMM")
  df$ENCODE <- names(chrom)[i]
  overlaps <- rbind(overlaps, df)
}

ids.enh <- unique(overlaps$peakID[grep("Enhancer", overlaps$chromHMM)])
length(ids.enh)
ids.prom <- unique(overlaps$peakID[grep("Promoter", overlaps$chromHMM)])
length(ids.prom)
ids.het <- unique(overlaps$peakID[grep("Hetero", overlaps$chromHMM)])
length(ids.het)

ids.het.enh <- ids.het[ids.het %in% ids.enh]
length(ids.het.enh)

## Test with a randomized set
rndm <- regioneR::randomizeRegions(sel)
rndm$geneID <- paste0("random_", 1:length(rndm))

overlaps.rndm <- data.frame()
for (i in 1:length(chrom)) {
  hmm <- chrom[[i]]
  ols <- findOverlaps(rndm,
                      hmm)
  df <- cbind(rndm$geneID[queryHits(ols)],
              hmm$name[subjectHits(ols)])
  df <- as.data.frame(df)
  colnames(df) <- c("peakID", "chromHMM")
  df$ENCODE <- names(chrom)[i]
  overlaps.rndm <- rbind(overlaps.rndm, df)
}

ids.enh.rndm <- unique(overlaps.rndm$peakID[grep("Enhancer", overlaps.rndm$chromHMM)])
length(ids.enh.rndm)
ids.prom.rndm <- unique(overlaps.rndm$peakID[grep("Promoter", overlaps.rndm$chromHMM)])
length(ids.prom.rndm)
ids.het.rndm <- unique(overlaps.rndm$peakID[grep("Hetero", overlaps.rndm$chromHMM)])
length(ids.het.rndm)

ids.het.enh.rndm <- ids.het.rndm[ids.het.rndm %in% ids.enh.rndm]
length(ids.het.enh.rndm)

df <- data.frame("class"=rep(c("Enhancer", "Promoter"), 2),
                 "regions"=c(rep("IREs", 2), rep("Random", 2)),
                 "overlaps"=c(length(ids.enh), length(ids.prom),
                              length(ids.enh.rndm), length(ids.prom.rndm)))

mat <- matrix(df$overlaps, ncol=2)

save(df, file=file.path(out_dir, "ENH_chromHMM_IREs.rda"))
load(file.path(out_dir, "ENH_chromHMM_IREs.rda"))
bar.chrom <-
ggplot(df[df$class!="Promoter",],
aes(class, overlaps)) +
geom_bar(aes(fill=regions), stat="identity",
position="dodge", color="black",
width=0.7) +
xlab("ChromHMM class") +
scale_y_continuous(labels=scales::comma,
breaks=scales::pretty_breaks(),
name="# of overlapping IREs") +
scale_fill_manual(values=c("#e37418", "#0c3a5c"),
name="Source") +
annotate("text", 1, 2800, label="*", size=8) +
theme(legend.position=c(0.55, 0.85))
bar.chrom
| Version | Author | Date |
|---|---|---|
| 4dbeb03 | Mireia Ramos | 2020-05-13 |
Transcription factor analysis
de novo motif analysis
library(maRge)

deNovoMotifHOMER(bed="../data/CYT/bedfiles/IREs_endoc_fc1_padj0.05_opening_distal.bed",
                 path_output=file.path(out_dir, "HOMER_IREs_endoc_opening_distal_mask"),
                 other_param="-mask",
                 path_homer="~/tools/homer/")

deNovoMotifHOMER(bed="../data/CYT/bedfiles/IREs_endoc_fc1_padj0.05_primed_distal.bed",
                 path_output=file.path(out_dir, "HOMER_IREs_endoc_primed_distal_mask"),
                 other_param="-mask",
                 path_homer="~/tools/homer/")

deNovoMotifHOMER(bed="../data/CYT/bedfiles/IREs_endoc_fc1_padj0.05_neo_distal.bed",
                 path_output=file.path(out_dir, "HOMER_IREs_endoc_neo_distal_mask"),
                 other_param="-mask",
                 path_homer="~/tools/homer/")
htmltools::includeHTML(file.path(out_dir, "HOMER_IREs_endoc_opening_distal_mask/homerResults.html"))Homer de novo Motif Results (HOMER_IREs_endoc_fc1_opening_distal_mask//)
Known Motif Enrichment ResultsGene Ontology Enrichment Results
If Homer is having trouble matching a motif to a known motif, try copy/pasting the matrix file into STAMP
More information on motif finding results: HOMER | Description of Results | Tips
Total target sequences = 1841
Total background sequences = 48084
* - possible false positive
| Rank | Motif | P-value | log P-pvalue | % of Targets | % of Background | STD(Bg STD) | Best Match/Details | Motif File |
| 1 | 1e-1270 | -2.925e+03 | 64.86% | 3.25% | 176.3bp (187.2bp) | IRF1(IRF)/PBMC-IRF1-ChIP-Seq(GSE43036)/Homer(0.987) More Information | Similar Motifs Found | motif file (matrix) | |
| 2 | 1e-27 | -6.289e+01 | 54.16% | 41.48% | 240.1bp (183.2bp) | Foxo1(Forkhead)/RAW-Foxo1-ChIP-Seq(Fan_et_al.)/Homer(0.981) More Information | Similar Motifs Found | motif file (matrix) | |
| 3 | 1e-20 | -4.786e+01 | 20.91% | 12.95% | 256.5bp (183.8bp) | STAT3/MA0144.2/Jaspar(0.785) More Information | Similar Motifs Found | motif file (matrix) | |
| 4 | 1e-17 | -4.046e+01 | 31.99% | 23.14% | 263.6bp (180.4bp) | GSC(Homeobox)/FrogEmbryos-GSC-ChIP-Seq(DRA000576)/Homer(0.798) More Information | Similar Motifs Found | motif file (matrix) | |
| 5 | 1e-16 | -3.878e+01 | 21.73% | 14.37% | 256.3bp (186.7bp) | FOS::JUN/MA0099.2/Jaspar(0.925) More Information | Similar Motifs Found | motif file (matrix) | |
| 6 | 1e-15 | -3.675e+01 | 0.43% | 0.00% | 162.4bp (8.4bp) | FOS/MA0476.1/Jaspar(0.652) More Information | Similar Motifs Found | motif file (matrix) | |
| 7 | 1e-15 | -3.675e+01 | 0.43% | 0.00% | 189.9bp (0.0bp) | PH0171.1_Nkx2-1/Jaspar(0.597) More Information | Similar Motifs Found | motif file (matrix) | |
| 8 | 1e-15 | -3.589e+01 | 0.60% | 0.01% | 183.2bp (139.5bp) | PB0172.1_Sox1_2/Jaspar(0.743) More Information | Similar Motifs Found | motif file (matrix) | |
| 9 | 1e-14 | -3.324e+01 | 24.55% | 17.34% | 261.5bp (189.0bp) | Ap4(bHLH)/AML-Tfap4-ChIP-Seq(GSE45738)/Homer(0.912) More Information | Similar Motifs Found | motif file (matrix) | |
| 10 | 1e-13 | -3.082e+01 | 0.60% | 0.02% | 117.3bp (209.4bp) | Hand1::Tcf3/MA0092.1/Jaspar(0.623) More Information | Similar Motifs Found | motif file (matrix) | |
| 11 | 1e-12 | -2.984e+01 | 0.49% | 0.01% | 98.4bp (127.7bp) | Ahr::Arnt/MA0006.1/Jaspar(0.615) More Information | Similar Motifs Found | motif file (matrix) | |
| 12 | 1e-12 | -2.984e+01 | 0.49% | 0.01% | 138.6bp (103.8bp) | PB0139.1_Irf5_2/Jaspar(0.652) More Information | Similar Motifs Found | motif file (matrix) | |
| 13 | 1e-12 | -2.803e+01 | 0.43% | 0.01% | 123.4bp (36.2bp) | Bcl6/MA0463.1/Jaspar(0.649) More Information | Similar Motifs Found | motif file (matrix) | |
| 14 | 1e-12 | -2.803e+01 | 0.43% | 0.01% | 267.3bp (89.3bp) | DMRT3/MA0610.1/Jaspar(0.628) More Information | Similar Motifs Found | motif file (matrix) | |
| 15 | 1e-12 | -2.772e+01 | 8.37% | 4.55% | 251.7bp (175.5bp) | NFkB-p65(RHD)/GM12787-p65-ChIP-Seq(GSE19485)/Homer(0.856) More Information | Similar Motifs Found | motif file (matrix) | |
| 16 * | 1e-11 | -2.659e+01 | 0.38% | 0.01% | 137.8bp (135.5bp) | PB0056.1_Rfxdc2_1/Jaspar(0.716) More Information | Similar Motifs Found | motif file (matrix) | |
| 17 * | 1e-11 | -2.659e+01 | 0.38% | 0.01% | 193.3bp (181.5bp) | Znf263(Zf)/K562-Znf263-ChIP-Seq(GSE31477)/Homer(0.620) More Information | Similar Motifs Found | motif file (matrix) | |
| 18 * | 1e-11 | -2.619e+01 | 0.33% | 0.00% | 125.2bp (195.5bp) | Smad2(MAD)/ES-SMAD2-ChIP-Seq(GSE29422)/Homer(0.655) More Information | Similar Motifs Found | motif file (matrix) | |
| 19 * | 1e-11 | -2.619e+01 | 0.33% | 0.00% | 172.6bp (0.0bp) | Smad3(MAD)/NPC-Smad3-ChIP-Seq(GSE36673)/Homer(0.560) More Information | Similar Motifs Found | motif file (matrix) | |
| 20 * | 1e-11 | -2.619e+01 | 0.33% | 0.00% | 73.9bp (8.7bp) | POL009.1_DCE_S_II/Jaspar(0.579) More Information | Similar Motifs Found | motif file (matrix) | |
| 21 * | 1e-11 | -2.619e+01 | 0.33% | 0.00% | 304.2bp (72.7bp) | PH0026.1_Duxbl/Jaspar(0.589) More Information | Similar Motifs Found | motif file (matrix) | |
| 22 * | 1e-11 | -2.619e+01 | 0.33% | 0.00% | 126.0bp (0.0bp) | PB0104.1_Zscan4_1/Jaspar(0.687) More Information | Similar Motifs Found | motif file (matrix) | |
| 23 * | 1e-10 | -2.499e+01 | 7.44% | 4.03% | 218.5bp (180.3bp) | PB0121.1_Foxj3_2/Jaspar(0.686) More Information | Similar Motifs Found | motif file (matrix) | |
| 24 * | 1e-10 | -2.445e+01 | 2.23% | 0.64% | 250.2bp (176.3bp) | EBF1(EBF)/Near-E2A-ChIP-Seq(GSE21512)/Homer(0.882) More Information | Similar Motifs Found | motif file (matrix) | |
| 25 * | 1e-10 | -2.401e+01 | 0.43% | 0.01% | 321.4bp (98.2bp) | PB0139.1_Irf5_2/Jaspar(0.573) More Information | Similar Motifs Found | motif file (matrix) | |
| 26 * | 1e-10 | -2.378e+01 | 0.38% | 0.01% | 247.4bp (126.9bp) | Chop(bZIP)/MEF-Chop-ChIP-Seq(GSE35681)/Homer(0.642) More Information | Similar Motifs Found | motif file (matrix) | |
| 27 * | 1e-10 | -2.324e+01 | 3.26% | 1.26% | 263.5bp (180.7bp) | CEBP:AP1(bZIP)/ThioMac-CEBPb-ChIP-Seq(GSE21512)/Homer(0.597) More Information | Similar Motifs Found | motif file (matrix) | |
| 28 * | 1e-9 | -2.207e+01 | 0.33% | 0.01% | 78.6bp (254.1bp) | PB0120.1_Foxj1_2/Jaspar(0.623) More Information | Similar Motifs Found | motif file (matrix) | |
| 29 * | 1e-9 | -2.207e+01 | 0.33% | 0.01% | 130.5bp (31.8bp) | ETV6/MA0645.1/Jaspar(0.631) More Information | Similar Motifs Found | motif file (matrix) | |
| 30 * | 1e-9 | -2.113e+01 | 0.27% | 0.00% | 248.9bp (0.0bp) | PB0117.1_Eomes_2/Jaspar(0.632) More Information | Similar Motifs Found | motif file (matrix) | |
| 31 * | 1e-9 | -2.113e+01 | 0.27% | 0.00% | 60.0bp (0.0bp) | PB0148.1_Mtf1_2/Jaspar(0.662) More Information | Similar Motifs Found | motif file (matrix) | |
| 32 * | 1e-8 | -1.967e+01 | 0.33% | 0.01% | 80.0bp (174.1bp) | OTX1/MA0711.1/Jaspar(0.649) More Information | Similar Motifs Found | motif file (matrix) | |
| 33 * | 1e-8 | -1.903e+01 | 0.38% | 0.01% | 136.7bp (198.8bp) | ZNF519(Zf)/HEK293-ZNF519.GFP-ChIP-Seq(GSE58341)/Homer(0.674) More Information | Similar Motifs Found | motif file (matrix) | |
| 34 * | 1e-7 | -1.770e+01 | 0.27% | 0.00% | 195.2bp (24.9bp) | GCM2/MA0767.1/Jaspar(0.620) More Information | Similar Motifs Found | motif file (matrix) | |
| 35 * | 1e-6 | -1.571e+01 | 0.27% | 0.01% | 29.9bp (124.7bp) | ZBTB7C/MA0695.1/Jaspar(0.640) More Information | Similar Motifs Found | motif file (matrix) | |
| 36 * | 1e-6 | -1.430e+01 | 0.27% | 0.01% | 161.2bp (111.6bp) | Sox9(HMG)/Limb-SOX9-ChIP-Seq(GSE73225)/Homer(0.582) More Information | Similar Motifs Found | motif file (matrix) | |
| 37 * | 1e-5 | -1.233e+01 | 0.27% | 0.01% | 95.7bp (56.9bp) | PB0201.1_Zfp281_2/Jaspar(0.703) More Information | Similar Motifs Found | motif file (matrix) |