#2 Changes in transcription and translation
Chromatin changes link to variation in transcription and translation
Mireia Ramos-Rodríguez
Details
- Original publication:
Ramos-Rodríguez, M., Raurell-Vila, H., Colli, M.L. et al. The impact of proinflammatory cytokines on the β-cell regulatory landscape provides insights into the genetics of type 1 diabetes. Nat Genet. 51, 1588–1595 (2019) https://doi.org/10.1038/s41588-019-0524-6
Contents: Analyses and figures contained in this document correspond to the following figures/sections of the original publication:
- Results: “Chromatin changes link to variation in transcription and translation”.
- Figure 1: “Proinflammatory cytokine exposure causes profound remodeling of the \(\beta\)-cell regulatory landscape”. Panels c to e.
- Extended Data Figure 1: “Chromatin characterization of human pancreatic β cells exposed to pro-inflammatory cytokines”. Panel a.
- Extended Data Figure 2: “Exposure to pro-inflammatory cytokines drives changes in the transcriptome and proteome of pancreatic \(\beta\) cells”. Panels a to c and e to f.
Analysis of RNA-seq data
Quality control
Rscript code/QC_CORR_genome.R data/CYT/RNA/BAM/ data/CYT/RNA/QC/ get_upper_tri <- function(cormat){
cormat[lower.tri(cormat)]<- NA
return(cormat)
}
get_lower_tri <- function(cormat){
cormat[upper.tri(cormat)]<- NA
return(cormat)
}load("../data/CYT/RNA/QC/COR_10kb_norm.rda")
cor.mat.ctrl <- get_lower_tri(cor(mat[,grep("ctrl", colnames(mat))], method="pearson"))
ctrl.m <- reshape2::melt(cor.mat.ctrl, na.rm=TRUE)
c.ctrl.RNA <-
ggplot(data = ctrl.m, aes(Var2, Var1, fill = value))+
geom_tile(color = "black", lwd=0.7)+
scale_fill_gradient2(low = "white", high = "slateblue4", mid = "skyblue2",
midpoint = 0.5, limit = c(0,1), space = "Lab",
name="Pearson\nCorrelation") +
geom_text(aes(label=round(value, 2)), size=3) +
theme_minimal() +
theme(axis.text.x = element_text(angle = 45, vjust = 1,
size = 12, hjust = 1),
axis.title=element_blank(),
panel.grid.major = element_blank(),
legend.position="none") +
coord_fixed() +
ggtitle("RNA-seq genome-wide correlation")
cor.mat.cyt <- get_upper_tri(cor(mat[,grep("cyt", colnames(mat))], method="pearson"))
cyt.m <- reshape2::melt(cor.mat.cyt, na.rm=TRUE)
c.cyt.RNA <-
ggplot(data = cyt.m, aes(Var2, Var1, fill = value))+
geom_tile(color = "black", lwd=0.7)+
scale_fill_gradient2(low = "white", high = "slateblue4", mid = "skyblue2",
midpoint = 0.5, limit = c(0,1), space = "Lab",
name="Pearson\nCorrelation") +
geom_text(aes(label=round(value, 2)), size=3) +
theme_minimal() +
theme(axis.text.x = element_text(angle = 45, vjust = 1,
size = 12, hjust = 1),
axis.title=element_blank(),
legend.justification = c(1, 0),
legend.position = c(0.6, 0.75),
legend.direction = "horizontal",
panel.grid.major = element_blank()) +
coord_fixed() +
guides(fill = guide_colorbar(barwidth = 7, barheight = 1,
title.position = "top", title.hjust = 0.5))
cor.rep.RNA <- plot_grid(c.ctrl.RNA, c.cyt.RNA)
cor.rep.RNA
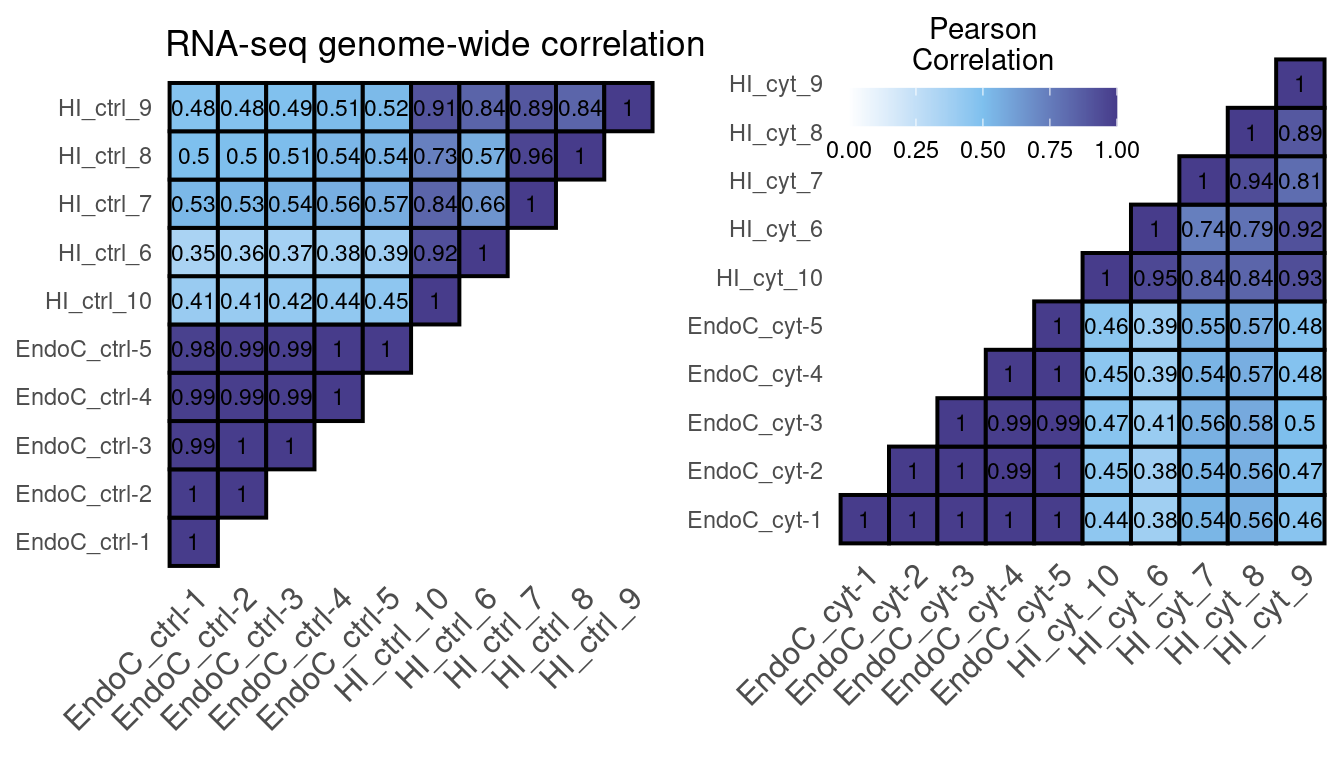
Figure 1: RNA-seq correlation using the number of reads in a 10kb binned genome normalized with DESeq2.
| Version | Author | Date |
|---|---|---|
| 2b4820d | Mireia Ramos | 2020-05-06 |
Differential analysis
cd data/CYT/RNA
Rscript ../../code/CYT_diffAnalysis_DESeq2_rna.R -f 1 -q 0.05 -b TRUE -s hi
Rscript ../../code/CYT_diffAnalysis_DESeq2_rna.R -f 1 -q 0.05 -b TRUE -s endoc
load("../data/CYT/RNA/diffAnalysis/RNA_endoc_GRangesBatch.rda")
as.data.frame(table(res.gr$type, res.gr$gene_biotype)) %>%
reshape2::dcast(Var1~Var2) %>%
as_tibble() %>%
mutate(Other = reduce(select(., !matches(c("Var1", "protein_coding"))), `+`)) %>%
select(Var1, protein_coding, Other) %>%
knitr::kable(format="html",
format.args = list(big.mark = ","),
col.names = c("Gene type", "Protein coding", "Other"),
caption = "Number of genes classified according to significance and biotype in RNA-seq EndoC samples.") %>%
kable_styling(full_width = FALSE) %>%
add_header_above(c(" " = 1, "Gene Biotype" = 2))| Gene type | Protein coding | Other |
|---|---|---|
| gained | 934 | 351 |
| lost | 811 | 185 |
| stable | 18,538 | 36,364 |
volc_ec <-
  ggplot(data.frame(res.gr),
       aes(log2FoldChange, -log10(padj))) +
  geom_point(aes(color=type), size=0.4) +
  scale_color_manual(values=pals$differential,
                    name="Gene type") +
  geom_vline(xintercept=c(1,-1), linetype=2, color="dark grey") +
  geom_hline(yintercept=-log10(0.05), linetype=2, color="dark grey") +
  xlab(expression(Log[2]*" fold-change")) + ylab(expression(-Log[10]*" FDR adjusted P")) +
  ggtitle(expression("RNA-seq EndoC-"*beta*H1)) +
  theme(legend.position="none")
load("../data/CYT/RNA/diffAnalysis/RNA_hi_GRangesBatch.rda")
as.data.frame(table(res.gr$type, res.gr$gene_biotype)) %>%
reshape2::dcast(Var1~Var2) %>%
mutate(Other = reduce(select(., !matches(c("Var1", "protein_coding"))), `+`)) %>%
select(Var1, protein_coding, Other) %>%
knitr::kable(format="html",
format.args = list(big.mark = ","),
col.names = c("Gene type", "Protein coding", "Other"),
caption = "Number of genes classified according to significance and biotype in RNA-seq HI samples.") %>%
kable_styling(full_width = FALSE) %>%
add_header_above(c(" " = 1, "Gene Biotype" = 2))| Gene type | Protein coding | Other |
|---|---|---|
| gained | 1,290 | 453 |
| lost | 1,081 | 524 |
| stable | 17,985 | 36,572 |
volc_hi <-
  ggplot(data.frame(res.gr),
       aes(log2FoldChange, -log10(padj))) +
  geom_point(aes(color=type), size=0.4) +
  scale_color_manual(values=pals$differential,
                    name="Gene type") +
  geom_vline(xintercept=c(1,-1), linetype=2, color="dark grey") +
  geom_hline(yintercept=-log10(0.05), linetype=2, color="dark grey") +
  xlab(expression(Log[2]*" fold-change")) + ylab(expression(-Log[10]*" FDR adjusted P")) +
  ggtitle(expression("RNA-seq HI")) +
  theme(legend.position="none")
plot_grid(volc_ec,
volc_hi,
ncol=2)
Figure 2: Volcano plots showing RNA-seq genes in EndoC and human islet (HI) samples. The horizontal line denotes the FDR adjusted P-value threshold set at 0.05 and the vertical lines the log2 fold-change thresholds, at -1 and 1. Up-regulated genes are represented in green and down-regulated genes are shown in red.
| Version | Author | Date |
|---|---|---|
| 2b4820d | Mireia Ramos | 2020-05-06 |
load("../data/CYT/RNA/diffAnalysis/RNA_endoc_GRangesBatch.rda")
ec <- res.gr

load("../data/CYT/RNA/diffAnalysis/RNA_hi_GRangesBatch.rda")
hi <- res.gr

colnames(mcols(ec))[c(5,10)] <- paste0("endoc.", colnames(mcols(ec))[c(5,10)])
colnames(mcols(hi))[c(5,10)] <- paste0("hi.", colnames(mcols(hi))[c(5,10)])

df <- dplyr::left_join(data.frame(mcols(ec))[,c(1,5,10)],
                       data.frame(mcols(hi))[,c(1,5,10)])

ggplot(df,
       aes(endoc.type, hi.log2FoldChange)) +
  geom_boxplot(aes(color=endoc.type), notch=TRUE, outlier.shape=NA,
               lwd=1) +
  scale_color_manual(values=pals$differential,
                    name="Gene type") +
  geom_hline(yintercept=c(1,0,-1), lty=c(2,1,2), color="grey") +
  scale_y_continuous(name=expression("HI "*log[2]*" FC")) +
  theme(legend.position="none",
        strip.background = element_rect(fill="white", linetype=1, size=.5, color="black")) +
  scale_x_discrete(name=expression("EndoC-"*beta*"H1 region type"),
                   labels=c("Up-regulated", "Down-regulated", "Equal-regulated")) +
  coord_cartesian(ylim=c(-4,6))
Figure 3: Boxplot of HI log2FC at genes classified as up-, down- or equal-regulated in EndoC cells. Horizontal dashed lines show the upper and lower log2 FC thresholds.
| Version | Author | Date |
|---|---|---|
| 2b4820d | Mireia Ramos | 2020-05-06 |
Analysis of multiplex proteomics data
Differential analysis
load("../data/CYT/Proteomics/proteomics_data_type.rda")

table(data$type)
gained   lost stable
   223    125   9818
volc.rna <-
ggplot(data.frame(data),
aes(log2FoldChange, -log10(pvalue))) +
geom_point(aes(color=type), size=0.7) +
scale_color_manual(values=pals$differential,
name="PROT type") +
geom_vline(xintercept=c(0.58,-0.58), linetype=2, color="dark grey") +
# geom_hline(yintercept=-log10(0.1), linetype=2, color="dark grey") +
xlab(expression(Log[2]*" fold change")) + ylab(expression(-Log[10]*" P")) +
ggtitle(expression("Proteomics EndoC-"*beta*H1)) +
theme_cowplot(18) +
theme(legend.position="none")
volc.rna
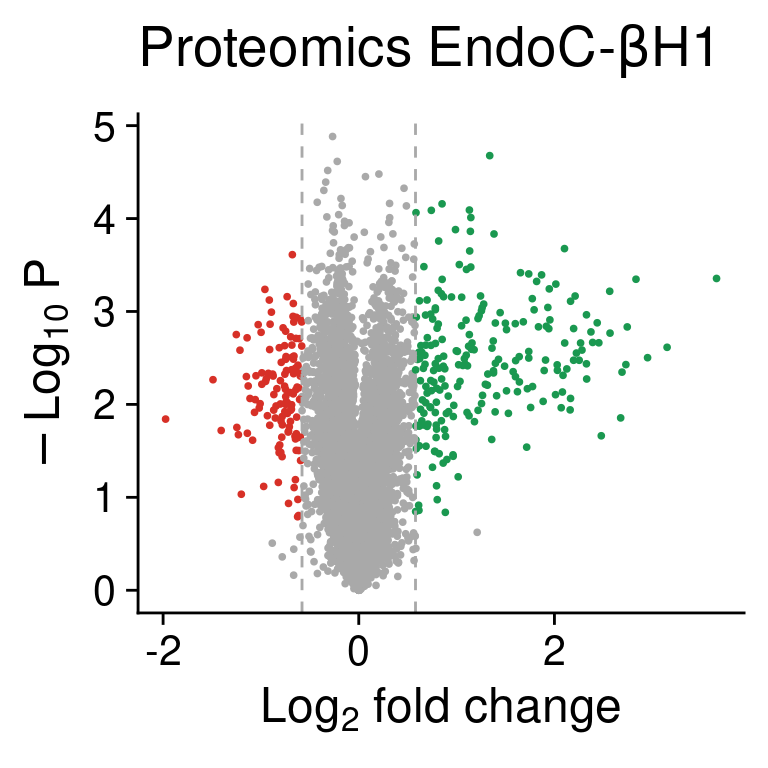
Figure 4: Volcano plot showing detected proteins classified as more abundant (green) or less abundant (red) after cytokine exposure in EndoC cells.
| Version | Author | Date |
|---|---|---|
| a649a86 | Mireia Ramos | 2020-05-13 |
Protein-protein interaction network
??
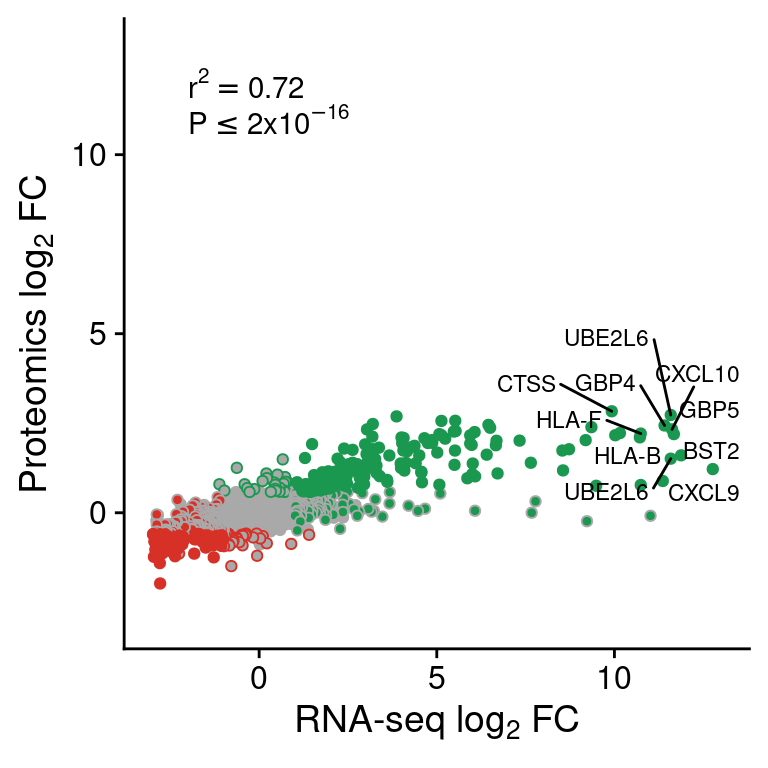
Correlation mRNA and protein product
load("../data/CYT/RNA/diffAnalysis/RNA_endoc_GRangesBatch.rda")
load("../data/CYT/Proteomics/proteomics_data_type.rda")
colnames(data)[c(4,17)] <- paste0("prot.", colnames(data[c(4,17)]))

cor <- dplyr::left_join(data.frame(mcols(res.gr)[,c(1:3,5,10)]),
                        data[,c(9,4,17)])
colnames(cor)[4:5] <- paste0("rna.", colnames(cor)[4:5])
cor <- cor[!is.na(cor$prot.type),]

test <- cor.test(cor$rna.log2FoldChange, cor$prot.log2FoldChange)
cor <- cor[order(cor$rna.log2FoldChange+cor$prot.log2FoldChange, decreasing = T),]

cor$lab <- NA
cor$lab[1:10] <- cor$external_gene_name[1:10]

cor$rna.type <- factor(cor$rna.type, levels=c("stable", "lost", "gained"))
cor$prot.type <- factor(cor$prot.type, levels=c("stable", "lost", "gained"))
cor <- cor[order(cor$rna.type, cor$prot.type),]

cor.prot <-
  ggplot(cor,
       aes(rna.log2FoldChange, prot.log2FoldChange)) +
  geom_point(aes(color=prot.type, fill=rna.type), pch=21) +
  ggrepel::geom_text_repel(aes(label=lab), size=3) +
  annotate("text", x=-2, y=12,
           label=as.expression(bquote(r^2 == .(round(test$estimate, 2)))),
           hjust=0) +
  annotate("text", x=-2, y=11,
           label=expression(P<=2*x*10^-16),
           hjust=0) +
  scale_fill_manual(values=pals$differential) +
  scale_color_manual(values=pals$differential) +
  scale_y_continuous(limits=c(-3,13),
                     name=expression("Proteomics "*log[2]*" FC")) +
  scale_x_continuous(limits=c(-3,13),
                     name=expression("RNA-seq "*log[2]*" FC")) +
  theme(legend.position="none")

cor.prot
| Version | Author | Date |
|---|---|---|
| a649a86 | Mireia Ramos | 2020-05-13 |
Correlation REs and mRNA/Protein
Rscript code/CYT_annotate_RE_to_RNA_PROT.R -f 1 -q 0.05 -s endoc -w 30000
Rscript code/CYT_annotate_RE_to_RNA_PROT.R -f 1 -q 0.05 -s endoc -w 80000
files <- list.files(out_dir,
pattern="RNA_annotation_endoc_",
full.names=TRUE)
names <- gsub("RNA_annotation_endoc_fc1_padj0.05_", "", gsub(".rda", "", basename(files)))
anno.counts.all <- data.frame()
anno.group.all <- data.frame()
for (i in 1:length(files)) {
load(files[i])
anno.counts$win <- names[i]
anno.counts.all <- rbind(anno.counts.all, anno.counts)
anno.group$win <- names[i]
anno.group.all <- rbind(anno.group.all, anno.group)
}
anno.counts.all$win <- factor(anno.counts.all$win,
levels=unique(anno.counts.all$win))
anno.group.all$win <- factor(anno.group.all$win,
levels=unique(anno.counts.all$win))
rm(anno.counts, anno.group, anno)files <- list.files(out_dir,
pattern="PROT_annotation_endoc_",
full.names=TRUE)
names <- gsub("PROT_annotation_endoc_fc1_padj0.05_", "", gsub(".rda", "", basename(files)))
anno.prot.all <- data.frame()
for (i in 1:length(files)) {
load(files[i])
anno.prot$win <- names[i]
anno.prot.all <- rbind(anno.prot.all, anno.prot)
}
anno.prot.all$win <- factor(anno.prot.all$win,
levels=unique(anno.prot.all$win))
rm("anno.prot")RNA
anno.counts.all <- unique(anno.counts.all[,-1])

test <- anno.counts.all %>%
  group_by(type, win) %>%
  summarise(pval=wilcox.test(counts[treatment=="ctrl"],
                             counts[treatment=="cyt"],
                             paired=F)$p.value,
            num=length(counts[treatment=="ctrl"]))

test$lab <- ""
test$lab[test$pval<0.05] <- "*"
test$lab[test$pval<0.01] <- "**"
test$lab[test$pval<0.001] <- "***"

cor.rna <-
  ggplot(anno.counts.all[anno.counts.all$win=="win30000",],
       aes(type, log2(counts + 1))) +
  geom_boxplot(aes(color=treatment), notch=TRUE,
               outlier.shape=NA, lwd=1) +
  geom_text(data=test[test$win=="win30000",],
            aes(x=type, y=20, label=lab),
            size=5) +
  geom_label(data=test[test$win=="win30000",],
            aes(x=type, y=0, label=scales::comma(num)),
            size=3) +
  scale_color_manual(values=pals$treatment,
                     name="Treatment", labels=function(x) toupper(x)) +
  scale_x_discrete(labels=function(x) paste0(x, "s")) +
  ylab(expression("RNA-seq "*log[2]*" counts")) +
  theme(legend.position="top",
        axis.title.x=element_blank())

cor.rna
| Version | Author | Date |
|---|---|---|
| a649a86 | Mireia Ramos | 2020-05-13 |
nums <- anno.group.all %>%
  group_by(win, group) %>%
  summarise(num=length(log2FoldChange))

group.rna <-
  ggplot(anno.group.all[anno.group.all$win=="win80000",],
       aes(group, log2FoldChange)) +
  geom_boxplot(aes(color=group), notch=T, outlier.shape=NA, lwd=1) +
  scale_color_manual(values=c("slategray1", "slategray2", "slategray3", "slategray4")) +
  geom_label(data=nums[nums$win=="win80000",],
             aes(group, y=-1, label=scales::comma(num))) +
  geom_hline(yintercept=0, lty=2, color="grey") +
  scale_y_continuous(name=expression("RNA-seq "*log[2]*" FC"), limits=c(-1,6)) +
  annotate("text", 1.3, 5.8, label="P<2x10-16") +
  xlab("# of IREs") +
  theme(legend.position="none")

group.rna
| Version | Author | Date |
|---|---|---|
| a649a86 | Mireia Ramos | 2020-05-13 |
Protein
test <- wilcox.test(anno.prot.all$prot.log2FoldChange[anno.prot.all$win=="win30000" &
                                                        anno.prot.all$type=="IRE"],
                    anno.prot.all$prot.log2FoldChange[anno.prot.all$win=="win30000" &
                                                        anno.prot.all$type=="SRE"])

prot.distr <-
  ggplot(anno.prot.all[anno.prot.all$win=="win30000",],
       aes(prot.log2FoldChange)) +
  geom_density(aes(fill=type, color=type), alpha=0.1, lwd=.7) +
  scale_fill_manual(values=pals$re, name="RE type",
                    labels=function(x) paste0(x, "s")) +
  scale_color_manual(values=pals$re, name="RE type",
                    labels=function(x) paste0(x, "s")) +
  geom_vline(xintercept=c(-1,1), lty=2, color="grey") +
  annotate("text", 2, 3.5, label=expression(P<2*x*10^{-16})) +
  xlab(expression("Protein "*log[2]*" FC")) + ylab("Density") +
  theme(legend.position="top")

prot.distr
| Version | Author | Date |
|---|---|---|
| a649a86 | Mireia Ramos | 2020-05-13 |
anno.prot.all$type <- factor(anno.prot.all$type, levels=c("IRE", "SRE"))

prot.bar <-
  ggplot(anno.prot.all[anno.prot.all$win=="win30000",],
       aes(type, ..count..)) +
  geom_bar(aes(fill=prot.type),
           position="fill", color="black", width=0.7) +
  scale_fill_manual(values=pals$differential,
                    name="Protein type",
                    labels=c("Up-regulated", "Down-regulated", "Equal-regulated")) +
  annotate("text", 1.5, 1.05, label="***", size=6) +
  scale_y_continuous(labels=function(x) x*100,
                     name="% Proteins") +
  scale_x_discrete(labels=function(x) paste0(x, "s")) +
  theme(legend.position="top",
        axis.title.x=element_blank()) +
  guides(fill=guide_legend(ncol=1))

prot.bar
| Version | Author | Date |
|---|---|---|
| a649a86 | Mireia Ramos | 2020-05-13 |
sessionInfo()R version 4.0.2 (2020-06-22)
Platform: x86_64-pc-linux-gnu (64-bit)
Running under: Ubuntu 20.04.1 LTS
Matrix products: default
BLAS: /usr/lib/x86_64-linux-gnu/blas/libblas.so.3.9.0
LAPACK: /usr/lib/x86_64-linux-gnu/lapack/liblapack.so.3.9.0
locale:
[1] LC_CTYPE=en_US.UTF-8 LC_NUMERIC=C
[3] LC_TIME=es_ES.UTF-8 LC_COLLATE=C
[5] LC_MONETARY=es_ES.UTF-8 LC_MESSAGES=en_US.UTF-8
[7] LC_PAPER=es_ES.UTF-8 LC_NAME=C
[9] LC_ADDRESS=C LC_TELEPHONE=C
[11] LC_MEASUREMENT=es_ES.UTF-8 LC_IDENTIFICATION=C
attached base packages:
[1] parallel stats4 stats graphics grDevices utils datasets
[8] methods base
other attached packages:
[1] purrr_0.3.4 dplyr_1.0.1 kableExtra_1.1.0
[4] cowplot_1.0.0 ggplot2_3.3.2 GenomicRanges_1.41.5
[7] GenomeInfoDb_1.25.8 IRanges_2.23.10 S4Vectors_0.27.12
[10] BiocGenerics_0.35.4 workflowr_1.6.2
loaded via a namespace (and not attached):
[1] Biobase_2.49.0 httr_1.4.2
[3] splines_4.0.2 bit64_4.0.2
[5] viridisLite_0.3.0 highr_0.8
[7] blob_1.2.1 GenomeInfoDbData_1.2.3
[9] ggrepel_0.8.2 yaml_2.2.1
[11] pillar_1.4.6 RSQLite_2.2.0
[13] backports_1.1.8 lattice_0.20-41
[15] glue_1.4.1 digest_0.6.25
[17] RColorBrewer_1.1-2 promises_1.1.1
[19] XVector_0.29.3 rvest_0.3.6
[21] colorspace_1.4-1 plyr_1.8.6
[23] htmltools_0.5.0 httpuv_1.5.4
[25] Matrix_1.2-18 DESeq2_1.29.8
[27] XML_3.99-0.5 pkgconfig_2.0.3
[29] genefilter_1.71.0 bookdown_0.20
[31] zlibbioc_1.35.0 xtable_1.8-4
[33] scales_1.1.1 webshot_0.5.2
[35] whisker_0.4 later_1.1.0.1
[37] BiocParallel_1.23.2 git2r_0.27.1
[39] tibble_3.0.3 annotate_1.67.0
[41] farver_2.0.3 generics_0.0.2
[43] ellipsis_0.3.1 withr_2.2.0
[45] SummarizedExperiment_1.19.6 survival_3.2-3
[47] magrittr_1.5 crayon_1.3.4
[49] memoise_1.1.0 evaluate_0.14
[51] fs_1.5.0 xml2_1.3.2
[53] tools_4.0.2 hms_0.5.3
[55] lifecycle_0.2.0 matrixStats_0.56.0
[57] stringr_1.4.0 locfit_1.5-9.4
[59] munsell_0.5.0 DelayedArray_0.15.7
[61] AnnotationDbi_1.51.3 compiler_4.0.2
[63] rlang_0.4.7 grid_4.0.2
[65] RCurl_1.98-1.2 rstudioapi_0.11
[67] labeling_0.3 bitops_1.0-6
[69] rmarkdown_2.3 gtable_0.3.0
[71] DBI_1.1.0 reshape2_1.4.4
[73] R6_2.4.1 knitr_1.29
[75] bit_4.0.4 rprojroot_1.3-2
[77] readr_1.3.1 stringi_1.4.6
[79] Rcpp_1.0.5 geneplotter_1.67.0
[81] vctrs_0.3.2 tidyselect_1.1.0
[83] xfun_0.16